

Most assessment teams find out their measurement quality broke the same way: someone complains. A hiring manager notices pass rates jumped 12 points after a form swap. A candidate appeals and the review surfaces an item that's been scoring backwards for three months. An auditor asks for drift evidence and the only answer is a shrug and a spreadsheet exported last quarter.
That reactive posture is the real problem. Not the broken item, not the bad form — the fact that nobody knew until it cost something. In software engineering, teams stopped flying blind years ago with observability: structured logs, contracts between systems, alerts tied to real failure conditions. Assessment programs are running production systems too — scoring engines, item banks, delivery pipelines, form assembly — but most of them have almost no instrumentation on the one thing that matters, which is whether the numbers coming out still mean what they're supposed to mean.
This is about what an actual assessment analytics observability stack looks like in practice. Not monitoring server uptime. Monitoring measurement quality — reliability, difficulty drift, DIF, scoring consistency — the psychometric health of the thing, continuously, in production.
Why measurement quality degrades quietly
The frustrating thing about psychometric drift is that it almost never announces itself. A server crash is loud. A reliability coefficient sliding from 0.84 to 0.76 over two testing windows makes no noise at all. Everything still runs. Scores still generate. Reports still export. The system looks healthy right up until it clearly isn't. A few patterns show up repeatedly across programs:
-
Content aging. An item that was fresh a year ago is now circulating in study groups. Its p-value climbs from 0.55 to 0.81. It still "works" mechanically, but it stopped discriminating.
-
Population shift. The candidates taking the test this quarter aren't the same mix as last quarter — different regions, different prep, different role profiles — and item behavior shifts under them.
-
Silent form changes. Someone rebuilt a form, swapped three items, and the equating assumptions nobody documented quietly stopped holding.
-
Pipeline bugs. A scoring key update, a reverse-coded item that didn't get flagged, a mapping error in an export. These are the scary ones because they corrupt data at the source.
The common thread is that the signal existed the whole time. The p-value was climbing month over month. The DIF flag tripped on the first window and nobody was watching. Observability isn't about generating new information — it's about making the information you already produce visible, timely, and tied to an action.
The four layers of an observability stack
Think of this as a stack because each layer depends on the one beneath it. You can't detect drift if you don't have clean event logs, and you can't trust your logs if there's no contract defining what a valid event looks like.
Eliminate assessment bottlenecks.
Evaloly simplifies every step from test design to results analysis, making assessments faster and more reliable.
- Customizable test creation
- Automated grading and analytics
- Secure distribution and proctoring
No credit card required
Layer 1: Event logging
Everything starts with capturing the right events, structured consistently, at the moment they happen. Not a nightly batch export. Events.
The non-negotiable events for measurement quality:
-
Response events — every item response with item ID, form ID, version, candidate pseudonymous ID, timestamp, response time, and scored outcome.
-
Scoring events — what key/model/rubric version produced the score, including the engine version.
-
Form assembly events — which items went into which form, when, and under whose authority.
-
Key/content change events — any edit to an item, key, or rubric, with before/after.
-
Accommodation and delivery context — proctoring mode, extended time, platform, so you can slice fairness analysis later.
The mistake most teams make here is logging the result but not the context. You stored the score. You didn't store which scoring key version produced it. Six weeks later you find a scoring bug and you literally cannot tell which responses were affected because the version was never on the event. Rescoring becomes a guessing game.
A clean event model is where this all connects to your broader data foundation — if you've already invested in a canonical assessment data model and taxonomy, your events should emit using those same IDs and field names. Observability built on inconsistent identifiers is observability you can't trust.
Layer 2: Data contracts
A data contract is just an enforced agreement about what valid data looks like, checked automatically, before bad data gets downstream. This is the layer almost everyone skips, and it's the one that saves you most often.
A contract specifies things like:
-
item_idmust exist in the current item bank and not be retired -
responsetimemsmust be between 200 and some ceiling (anything under 200ms on a reading-heavy item is a flag) -
scoremust fall within the item's defined range -
scoringkeyversionis required and must match a known version -
form_idmust reference a published, not draft, form
When a contract breaks, the event gets quarantined and an alert fires — before it pollutes your analytics. The alternative, which plays out constantly, is that malformed data flows silently into the warehouse, gets aggregated into a dashboard, and informs a decision three weeks before anyone realizes the underlying records were garbage.
Contracts turn "we discovered the problem during the appeal" into "the problem never reached the report."
Layer 3: Drift detectors tied to psychometric metrics
This is the heart of it. Generic data monitoring tools watch row counts and null rates. Useful, but not measurement quality. You need detectors wired to the statistics that actually define whether your scores are valid.
The detectors worth running continuously:
| Detector | What it watches | Typical trigger condition |
|---|---|---|
| Difficulty drift | Item p-value over rolling windows | Shift > 0.10 from baseline, or steady trend across 3 windows |
| Discrimination decay | Point-biserial / item-total correlation | Drops below 0.15, or falls > 0.10 from baseline |
| Reliability monitor | Form-level coefficient alpha / omega | Below program threshold (e.g. 0.80) |
| DIF watch | Differential item functioning by subgroup | Moderate-to-large DIF flag sustained across a window |
| Response-time anomaly | Median and tail response times per item | Sudden drop suggesting exposure/pre-knowledge |
| Score distribution shift | Pass rate, mean, SD per cohort | Movement beyond control limits vs rolling baseline |
| Equating stability | Anchor item performance across forms | Anchor drift beyond tolerance |
The key design principle: baselines, not fixed thresholds alone. A p-value of 0.78 isn't inherently bad. A p-value that moved from 0.54 to 0.78 in eight weeks absolutely is. The detector should compare against the item's own established baseline and against its peer group, then flag the delta. Raw thresholds generate noise; delta-from-baseline generates signal.
One underrated detector is the response-time anomaly. When an item's median solve time collapses, that's frequently your earliest warning of content leakage — often before the p-value even moves enough to trip the difficulty detector. It's a leading indicator where most psychometric stats are lagging ones.
Layer 4: Dashboards, SLOs, and runbooks
Detectors that fire into a void don't help anyone. The top layer is where signals become decisions: dashboards people actually look at, service levels that define acceptable measurement quality, and runbooks that say exactly what to do when something trips.
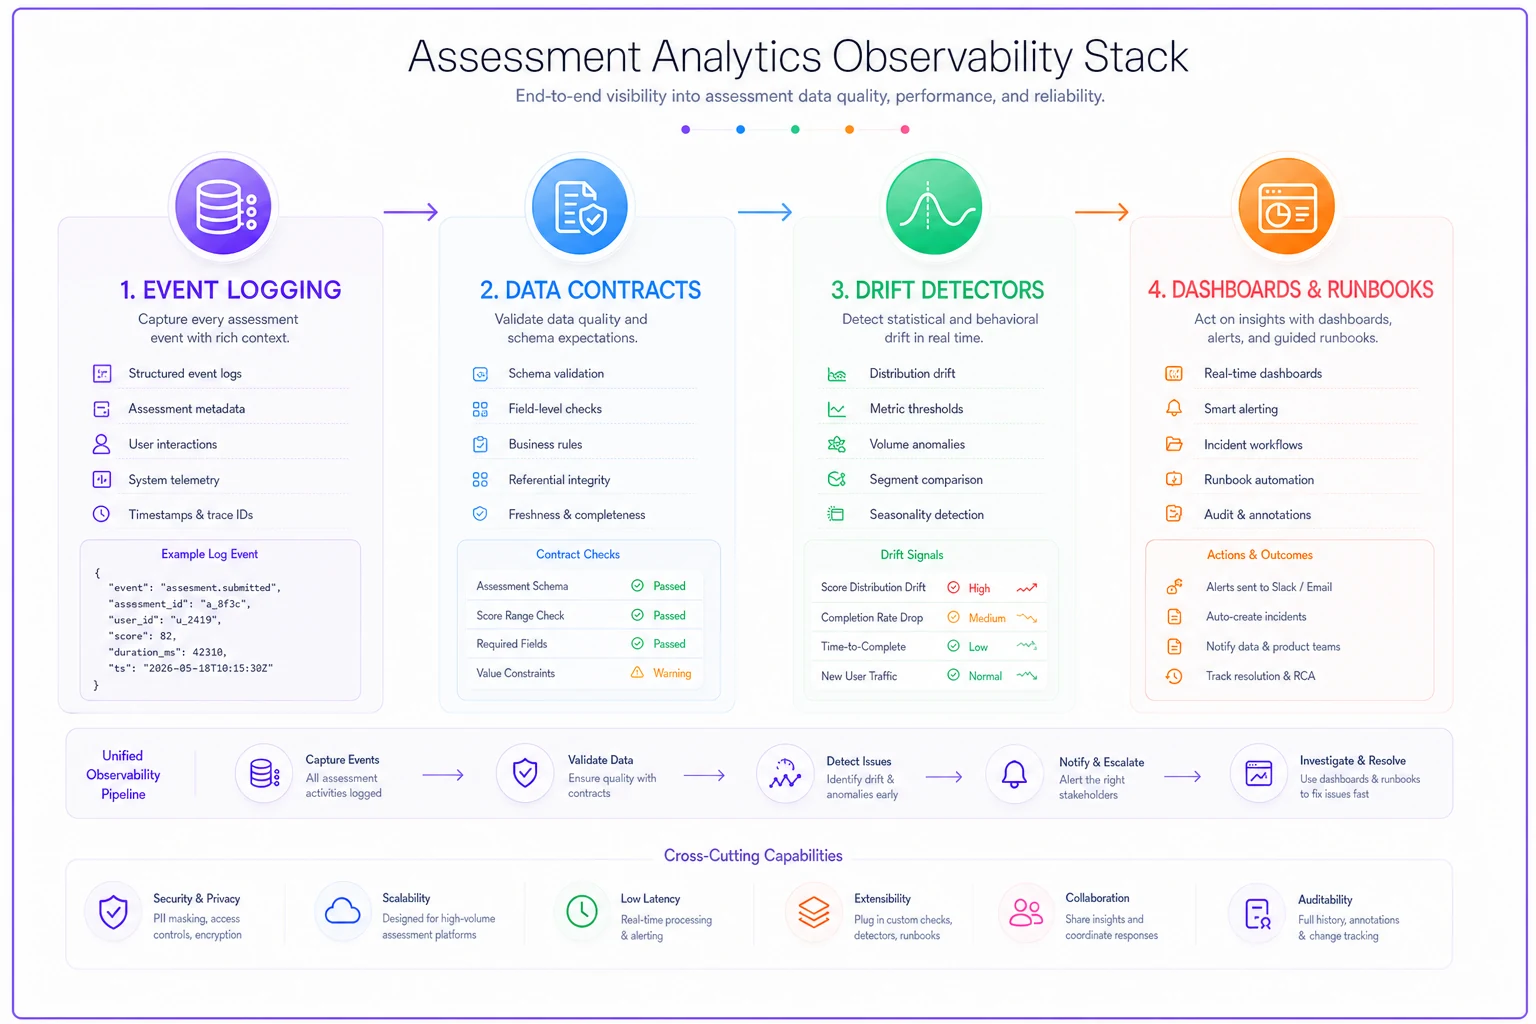
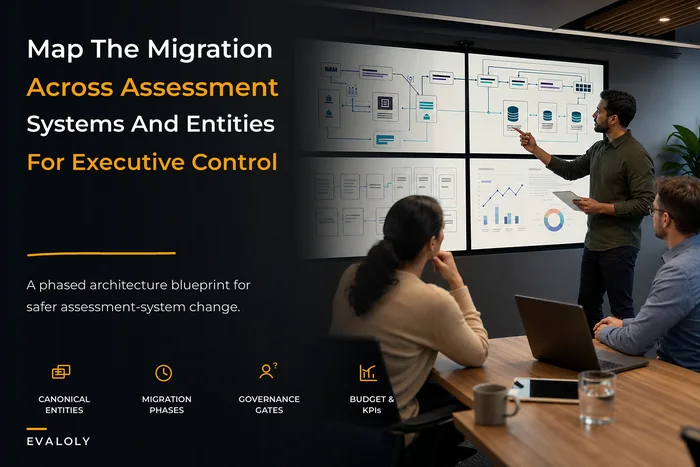
A simple workflow diagram like this clarifies ownership and data flow at a glance.
Sample dashboards worth building
You don't need twenty dashboards. Three, each aimed at a different altitude.
Program health (executive altitude). One screen: overall reliability trend, pass-rate stability, number of items currently flagged, open drift incidents, and days-since-last-equating-check. This belongs next to the rest of your enterprise assessment scorecard — it answers "can we still defend these scores?" in about ten seconds.
Item health (psychometrician altitude). A sortable item grid: current p-value, baseline p-value, delta, discrimination, DIF status, exposure count, last-reviewed date. Sort by biggest delta and your morning triage is done in fifteen minutes instead of a half-day spelunking expedition.
Pipeline health (engineering/ops altitude). Contract violation rates, quarantined event counts, scoring-engine version in production, event ingestion lag. This catches the mechanical failures — the scoring bugs and mapping errors — that corrupt data at the source.
The common failure with dashboards is building a beautiful item-health view and nothing else. Executives never look at it, so measurement quality never makes it into budget conversations, so it stays underfunded, so the next drift incident happens the same way as the last one. You need the full altitude range or the whole thing stays invisible to the people who fund it.
Defining SLOs and SLAs for measurement quality
This is where assessment teams can borrow directly from operations engineering, and almost nobody does. An SLO (service level objective) is your internal target. An SLA (service level agreement) is what you commit to a stakeholder or regulator. Measurement quality deserves both.
A workable starter set:
-
Reliability SLO operational forms maintain coefficient alpha ≥ 0.80; alert if any live form drops below for a full window.
-
Drift response SLO any item tripping a difficulty or discrimination detector gets triaged within 2 business days.
-
Scoring integrity SLA scoring-engine version changes are validated against a reference set before production, with zero tolerance for an unreviewed key change reaching live scoring.
-
DIF review SLA sustained moderate/large DIF flags reviewed within one window and documented regardless of outcome.
-
Data freshness SLO psychometric dashboards reflect data no older than 24 hours.
The point of writing these down isn't bureaucracy. An SLO converts a vague worry ("is our reliability okay?") into a measurable, ownable commitment with a number attached. When something breaches, there's no debate about whether it matters — you already decided, in advance, that it did.
Runbooks: mapping alerts to psychometric remediations
An alert without a runbook just creates anxiety. The remediation has to be pre-decided, because the worst time to design your response is during the incident, when pressure is high and people improvise.
A condensed runbook structure for the most common triggers:
-
Difficulty drift flag fires. - Confirm it's not a data artifact (check contract logs for the item first). - Pull exposure count and response-time trend. Collapsing solve times + rising p-value = treat as suspected exposure, not aging. - If exposure-driven: retire or rotate the item, trigger a security review per your leak-response process. - If population-driven: flag for re-calibration, hold the item, don't retire. - Document the decision and reasoning on the item record.
-
Discrimination decay flag fires. - Check whether the key or rubric changed recently (change-event log). - If a key error is found: quarantine affected responses, scope the rescoring window using
scoringkeyversion, rescore, and queue affected candidates for communication. - If no key issue: route to item review for revision or retirement. -
DIF flag sustained. - Pull subgroup response data and context fields. - Route to fairness review — this is a human judgment call, not an auto-retire. - Document outcome either way; "we reviewed and retained it, here's why" is itself defensible evidence.
-
Reliability SLO breach on a live form. - Identify the weakest-contributing items from the item-health view. - Decide: swap items, pull the form, or accept with documented justification. - Notify score-report consumers if interpretation guidance needs to change.
-
Contract violation spike. - This is a pipeline incident, not a psychometric one. Escalate to engineering. - Freeze the affected export/scoring path until the malformed events stop. - Backfill-check: did any bad events reach production reporting before the spike was caught?
The connecting logic across all five: the alert tells you something moved; the runbook tells you whether it's a content problem, a security problem, or a pipeline problem — and who owns the next move. That routing is where observability actually pays off. Most teams lose days just arguing about which team should look at an anomaly.
What breaks as you scale
A single program with a few hundred candidates a cycle can get away with manual quarterly psychometric reviews. The math holds. One psychometrician can eyeball the item stats and catch the obvious problems.
Then the program grows. Suddenly you've got six certifications, forty forms, several thousand candidates a quarter, multiple delivery vendors, and continuous testing instead of discrete windows. The manual review that worked at small scale now has three structural failure points:
-
Volume outpaces human review. Nobody can eyeball four thousand items quarterly. Problems live for a full cycle before detection.
-
Coordination gaps. The psychometrician sees the drift, but the content team owns the item, and the engineering team owns the pipeline. Without defined ownership, flags bounce between teams for weeks.
-
Continuous delivery kills the "window." When testing never stops, there's no natural checkpoint to review stats. Observability has to become continuous because the testing became continuous.
This is exactly the transition where observability stops being a nice-to-have and becomes load-bearing infrastructure. It should sit inside your broader system design — the enterprise assessment architecture blueprint is where event logging, contracts, and the warehouse all have to agree on structure, or the observability layer inherits every inconsistency underneath it.
A real scenario
A mid-sized certification body — one professional credential, roughly 2,800 candidates a year across rolling windows — kept their item stats in a quarterly report. Competent team, just reactive.
An item's p-value had drifted from about 0.57 to 0.83 over two quarters as the content circulated in exam-prep forums. The quarterly cadence meant it ran compromised for close to five months. Pass rates on forms containing it crept up around 9 points. Nobody connected the dots until a competitor flagged the leaked content publicly and the board had to scramble — defending roughly a year of scores with no drift evidence and no documented review trail.
After that, they stood up continuous detectors on p-value delta and response-time anomalies, with a two-day triage SLO. On the very first live window, the response-time detector flagged two items whose median solve times had quietly dropped — one of which hadn't moved enough on p-value yet to look suspicious. Both turned out to be early-stage exposure. They rotated them out before pass rates moved at all.
The outcome wasn't dramatic in a flashy way. It was dramatic in a boring way: the next leak got caught in days instead of months, and when an auditor later asked for drift monitoring evidence, the answer was a dashboard and a documented runbook history instead of a scramble.
When this makes sense — and when it doesn't
When it's worth building: You're running continuous or high-stakes testing, you have multiple forms or programs, scores drive consequential decisions (hiring, certification, promotion), or you face audit/regulatory scrutiny. At that point, not having observability is a liability you're carrying whether you've named it or not.
When it's overkill: A single low-stakes formative assessment given once a term to a small group. A quarterly manual review is genuinely fine. Don't build a drift-detection stack for a classroom quiz.
Who should NOT start here: If your event logging is a mess and your IDs don't reconcile across systems, drift detectors built on that foundation will generate noise you can't trust, and you'll lose faith in the whole approach. Fix the data model and the contracts first. Detectors on top of dirty events are worse than no detectors, because false alarms train people to ignore real ones.
Where to actually begin
You don't roll this out all at once. The sequence that works:
-
Instrument your events with full context — especially version fields on scoring and content changes. This alone makes incident forensics possible.
-
Write three or four data contracts on the fields that cause the most downstream pain. Quarantine violations.
-
Stand up two detectors — difficulty drift (delta-from-baseline) and response-time anomaly. These two catch a surprising share of real incidents for very little effort.
-
Build the item-health dashboard first, then the program-health view so leadership can see it.
-
Write runbooks for your top three alert types before you need them. Pre-decide the remediation and the owner.
-
Set two or three SLOs you can actually meet, and review breaches monthly.
Start with the smallest instrumented event that unlocks effective forensics: the scoring event with version metadata.
The teams that do this well aren't running more sophisticated statistics than everyone else. They're running the same familiar psychometrics — just continuously, tied to alerts, routed to owners, and documented as they go. The shift from "we review scores every quarter" to "the system tells us the moment a score stops meaning what it should" is the entire point. Measurement quality was never really a statistics problem. It was an operations problem wearing a statistics costume.
The teams that do this well aren't running more sophisticated statistics than everyone else. They're running the same familiar psychometrics — just continuously, tied to alerts, routed to owners, and documented as they go. The shift from "we review scores every quarter" to "the system tells us the moment a score stops meaning what it should" is the entire point. Measurement quality was never really a statistics problem. It was an operations problem wearing a statistics costume.
Ready to revolutionize your evaluation process?
Join over 2,000 organizations using Evaloly to optimize assessments, improve learner outcomes, and make data-driven decisions.