


Most comparability problems don't show up because someone chose the wrong statistical method. They show up because nobody made a decision at all. Form B goes out the door, HR reports a pass rate, and three months later a hiring manager asks why the Q3 cohort looks weaker than Q2 when the job hasn't changed. Nobody can answer, because the two forms were never put on the same scale.
That's the real gap this piece addresses. Not the theory — the operating decision: given the data you actually have, do you run linear equating, IRT linking, or neither, and what do you write down so the number survives an audit six months later.
If you already track versions carefully (and if you don't, start with a branching and metadata model for assessment version control), equating is the layer that sits on top. It makes scores from different forms mean the same thing.
Start With the Decision, Not the Math
The mistake that costs teams the most isn't picking linear over IRT. It's picking a method your data can't support and then reporting the result as if it's solid. So before any formula, answer three questions about your situation.
Branch 1 — Do the two forms share common items (or a common group of test-takers)? If there's no overlap — no anchor items, no group that took both forms — you cannot equate. Full stop. You can only compare raw pass rates and label them clearly as not comparable. A surprising number of teams skip this check entirely.
Branch 2 — How much data do you have per form? IRT linking is data-hungry. If you're running a certification exam with 80 candidates a quarter, IRT parameter estimates will be unstable. You'll end up with false precision dressed up as rigor. Linear equating handles smaller samples far better.
Branch 3 — How different are the forms, and how high are the stakes? Two forms built from the same blueprint, similar difficulty, low-stakes internal training check? Linear is almost always fine. Forms that differ meaningfully in difficulty, adaptive delivery, or anything license- or hiring-related where a wrong scale decision has legal weight? That's IRT territory.
Do forms share anchor items OR a common group? │ ├── NO → Cannot equate. Report raw scores + "NOT COMPARABLE" flag. Stop. │ └── YES │ ├── Sample per form < ~200 AND forms similar in difficulty? │ → LINEAR EQUATING (mean or linear) │ ├── Sample per form ≥ ~500 AND stakes high / forms differ / adaptive? │ → IRT LINKING │ └── In between (200–500, moderate stakes)? → LINEAR now, plan for IRT as data accumulates
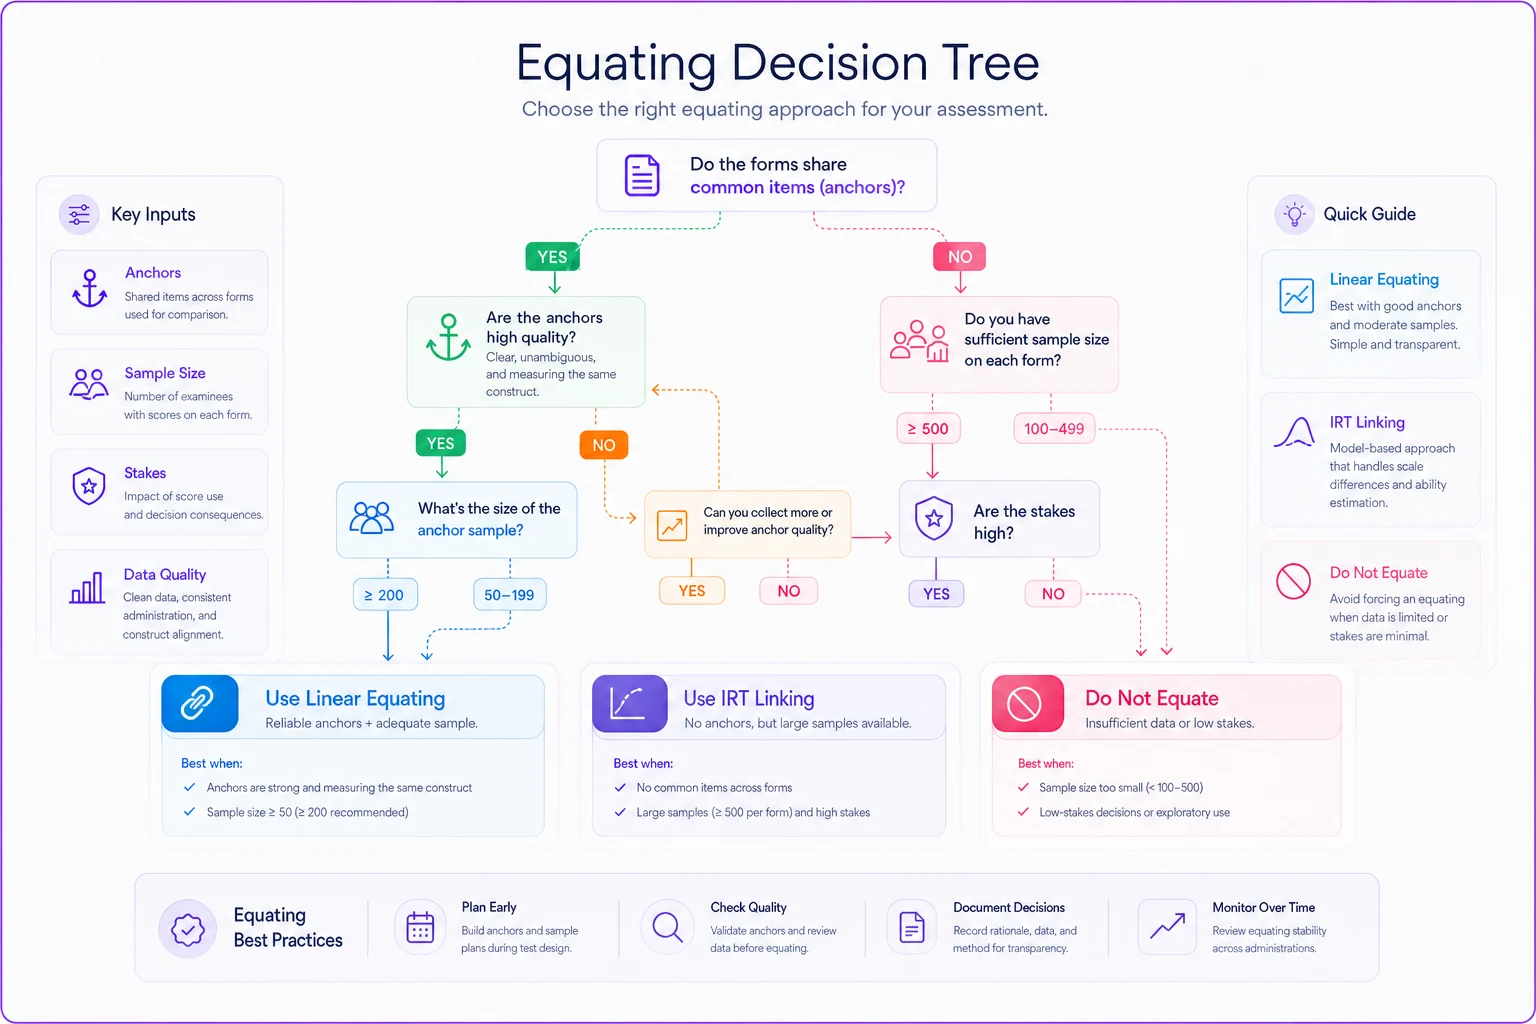
A simple visual like this helps teams use the same decision rubric instead of guessing.
Linear vs IRT: A Side-by-Side You Can Actually Use
Non-psychometricians get stuck comparing these because most explanations online are written for someone with a stats PhD. Here's the operational version — what each method demands and what it gives back.
Eliminate assessment bottlenecks.
Evaloly simplifies every step from test design to results analysis, making assessments faster and more reliable.
- Customizable test creation
- Automated grading and analytics
- Secure distribution and proctoring
No credit card required
| Factor | Linear Equating | IRT Linking |
|---|---|---|
| Minimum usable sample per form | ~100–200 | ~400–500+ (more for 3PL) |
| Anchor items needed | Helpful, sometimes optional | Required, and they must be stable |
| Handles adaptive / different-length forms | Poorly | Yes, natively |
| Ease of explaining to a hiring manager | Easy ("we adjusted for difficulty") | Hard (needs translation) |
| Setup time | Hours | Days to weeks |
| What breaks it | Very different form difficulty | Bad anchor items, sparse data |
| Best fit | Internal training, small cert programs, stable blueprints | Large-scale hiring assessments, licensure, adaptive tests |
Worth noting: most small and mid-size assessment programs think they need IRT and actually don't. They have 150 candidates a cycle and two forms off the same blueprint. Linear equating, done carefully and documented well, would serve them better and survive scrutiny more easily than an under-powered IRT model that looks impressive on a slide.
When linear equating actually makes sense
-
Internal L&D checks where the blueprint hasn't changed
-
Certification programs with a few hundred candidates or fewer per cycle
-
Forms deliberately built to be parallel
-
Situations where you need a defensible number this week, not next month
When IRT linking is worth the cost
-
Hiring assessments feeding decisions across thousands of candidates
-
Adaptive delivery where every candidate effectively sees a unique form
-
Licensure or anything where a challenged score decision ends up in a lawyer's inbox
-
Item banks large and stable enough that anchor items behave consistently
Who should NOT attempt IRT yet
If you can't answer "which items are our anchors and how do we know they're stable," you're not ready for IRT. Anchor drift silently poisons IRT linking, and you won't see it in the output — you'll only see it when a cohort looks wrong and you can't explain why. Get anchor monitoring in place first.
The Metadata You Must Capture — Or None of This Holds
Equating is only as trustworthy as the record behind it. This is where teams quietly sabotage themselves: they run the equating, report the scaled score, and never write down the inputs. Two quarters later nobody can reproduce it.
-
Form IDs being equated (base form and new form)
-
Method used (mean, linear, IRT — and which IRT model)
-
Anchor item IDs and how many
-
Sample size per form at the time of equating
-
Date of equating and who ran it
-
Software / version used
-
Anchor stability check result (passed / flagged)
-
Resulting conversion (raw-to-scale table or transformation coefficients)
-
A plain-language note on any judgment calls
Log the conversion table and the raw anchor responses together so anyone can re-run the mapping without hunting for sources.
That last one matters more than it looks. "Item 4412 flagged for possible drift, retained after review because content still aligned" is the sentence that saves you in an audit. Tie this back to your item-level analysis playbook — the same drift signals you watch at the item level are exactly what threaten your anchors.
Monitoring Cadence: How Often, and What Triggers a Rerun
Equating isn't a one-time event. Forms drift. Populations shift. An anchor item leaks and suddenly everyone gets it right. Without a monitoring rhythm, you discover this too late.
-
Every administration cycle Check anchor item performance against its historical baseline. Flag any anchor whose difficulty shifts beyond your threshold (a common rule: flag if the item's p-value moves more than about 0.10 from baseline).
-
Quarterly Review flagged anchors as a group. Decide retain / retire / replace. Document.
-
When you add or retire a form Re-run equating. Never assume the old conversion carries over.
-
When sample composition changes noticeably New market, new job family, sudden volume spike — recheck comparability before trusting cross-cohort comparisons.
-
Annually Full review of the linking chain. Small errors compound across chained equatings; once a year, sanity-check the whole trail end to end.
The failure mode is treating equating as "set it and forget it." A conversion table built on last year's population can quietly misrepresent this year's candidates, and because the number looks the same, nobody questions it.
Ready-to-Use Reporting Templates
The point of templates is to make the output legible to someone who will never read a psychometrics paper.
Template 1 — Equating Event Log (one row per event)
Date | New Form | Base Form | Method | Anchors (n) | Sample (new/base) | Anchor Check | Run By | Notes
Keep this as a running sheet. It's your audit trail and your memory.
Template 2 — Cohort Comparability Statement (for HR / execs)
> Comparability note — Q3 Hiring Assessment > Q3 candidates took Form C; Q2 took Form B. The two forms were placed on a common scale using [linear equating / IRT linking] with 12 shared anchor items. Scores below are directly comparable across quarters. One anchor item was flagged for review and retained after content check. Confidence: high.
Three sentences. A hiring manager can read it. It answers the "why does Q3 look different" question before it gets asked.
Template 3 — Non-Comparable Warning Block
> ⚠️ Not directly comparable. These forms share no anchor items or common group. Pass rates are reported as raw figures and should not be compared across cohorts. Interpret with caution.
Use this one honestly. The instinct is to compare anyway. Don't. A visible warning protects you far more than a falsely confident number.
A Real Scenario
A regional healthcare training group ran an internal competency check for new clinical staff — roughly 130 to 160 people per intake, four intakes a year. They'd been rotating two forms to reduce sharing, and reporting pass rates side by side as if the forms were interchangeable.
They weren't. Form 2 was noticeably harder. The winter intake showed a pass rate around 12 points lower than the fall intake, and leadership started asking whether the new hires were weaker or whether training had slipped. Both wrong. It was the form.
With their sample size, IRT was off the table — too few candidates for stable parameters. They set up linear equating using six anchor items already common to both forms, logged every field listed above, and re-issued the winter numbers on a common scale. The "12-point drop" shrank to roughly 3 points, well within normal cohort variation.
The concrete win wasn't statistical elegance. It was that the training director stopped defending a problem that didn't exist. And the equating log meant the next coordinator could reproduce the adjustment without re-learning everything from scratch. Setup took an afternoon plus some cleanup on the anchor records.
The One Thing to Get Right
Decide and document before you report. Pick linear or IRT based on your actual data and stakes, capture the metadata while you're doing it, and attach a plain-language comparability note to every cross-form number that leaves your team.
Modern assessment platforms can carry a lot of this — logging equating events, monitoring anchor drift automatically, attaching comparability flags to reports so the warning travels with the number instead of living in someone's head. That's genuinely useful once your volume grows. But the tooling only helps if the decision underneath it is sound. Get the branch right first. The templates just make sure the answer sticks.
Decide and document before you report. Pick linear or IRT based on your actual data and stakes, capture the metadata while you're doing it, and attach a plain-language comparability note to every cross-form number that leaves your team.
Modern assessment platforms can carry a lot of this — logging equating events, monitoring anchor drift automatically, attaching comparability flags to reports so the warning travels with the number instead of living in someone's head. That's genuinely useful once your volume grows. But the tooling only helps if the decision underneath it is sound. Get the branch right first. The templates just make sure the answer sticks.
Ready to revolutionize your evaluation process?
Join over 2,000 organizations using Evaloly to optimize assessments, improve learner outcomes, and make data-driven decisions.