

Most item analysis advice assumes you have hundreds of responses. Real assessment work rarely looks like that. A certification pilot with 38 candidates. A mid-year benchmark for two class sections totaling 51 students. An internal compliance quiz that 27 people finished before someone asked whether question 12 was "broken."
That's the awkward zone. Big enough that people expect numbers, small enough that those numbers lie to you constantly. The classic mistake isn't ignoring the data — it's treating a p-value or point-biserial from 30 responses with the same confidence you'd give one from 800.
This piece is about that specific problem: how to triage items honestly when N is small, when to resample instead of trust a single statistic, and — maybe most important — when to just not act yet.
Why small samples fool experienced people
The trap isn't ignorance. People who know item statistics still get burned here, because the statistics look identical whether you have 30 responses or 3,000. A discrimination index of 0.14 reads the same on the report. The difference is that with 30 people, that 0.14 could easily be 0.35 or -0.05 if you'd sampled a slightly different group.
-
One or two test-takers swing everything. With 25 responses, a single high-scorer who happened to miss an easy question can drag point-biserial into "flag this" territory. Remove them and the item looks fine.
-
Difficulty estimates are jumpy. A p-value of 0.62 vs 0.71 feels meaningfully different. At N=30 it isn't. The confidence interval around that proportion is roughly ±0.17. You genuinely cannot tell those two items apart.
-
Distractor analysis collapses. If only 9 people got an item wrong, you can't say anything reliable about which wrong answer is the problem. Three people picking option C isn't a pattern. It's three people.
The underlying point-biserial and difficulty math is the same math covered in the item-level analysis playbook — the interpretation is what changes. Small N doesn't break the formulas. It breaks your right to be confident about the outputs.
Conservative triage: three buckets instead of a cutoff
The single biggest fix is to stop using hard thresholds as decisions. A rule like "retire any item with discrimination below 0.20" works reasonably at N=500. At N=40 it will make you retire perfectly good items and keep genuinely bad ones, roughly at random.
Eliminate assessment bottlenecks.
Evaloly simplifies every step from test design to results analysis, making assessments faster and more reliable.
- Customizable test creation
- Automated grading and analytics
- Secure distribution and proctoring
No credit card required
| Bucket | What it means | Typical small-N signal | Action |
|---|---|---|---|
| Act now | Problem is obvious and doesn't need statistical confidence | Answer key is wrong, item is off-topic, near-zero or negative discrimination plus a content reviewer agrees something's off | Fix or pull immediately |
| Watch | Numbers look shaky but not alarming | Middling discrimination, moderate difficulty swings, small distractor oddities | Keep in bank, tag for review after more responses |
| Pause | Statistic looks bad but sample can't support the conclusion | Bad-looking number that flips when you resample, or driven by 1–2 responses | Do nothing yet; collect more data |
The thing most people miss: the "Act now" bucket at small N should almost always be driven by a qualitative reason, not a statistical one. If the only evidence an item is bad is a number from 35 responses, that's a "Pause," not an "Act now." Statistics from tiny cohorts confirm content judgments; they shouldn't originate decisions.
A simple bootstrap you can actually run in a spreadsheet
You don't need R or a stats team to see how fragile your numbers are. The bootstrap idea is straightforward: resample your existing responses, with replacement, a few hundred times, and watch how much the statistic moves around. If it bounces a lot, you can't trust the single value.
A process a corporate trainer or educator can run without specialized software:
-
Put your item responses in a column. One row per test-taker, scored 0/1 for the item, with their total score alongside.
-
Create a resample. Randomly draw the same number of rows with replacement — some people get picked twice, some not at all. Most spreadsheets can do this with a random index and a lookup.
-
Recompute the statistic — difficulty or point-biserial — on that resample.
-
Repeat 200–500 times. Copy the resample block down or use a small macro. You now have hundreds of versions of the same statistic.
-
Look at the spread. Sort those values and read off the 5th and 95th percentiles. That range is roughly your 90% interval.
A realistic result: an item shows point-biserial of 0.18 on your 42 responses. You bootstrap it and the 90% range comes back as -0.02 to 0.39. That item isn't "weak" — it's unknown. You literally cannot distinguish it from either a dead item or a strong one. That's a Pause, and the bootstrap is what tells you so.
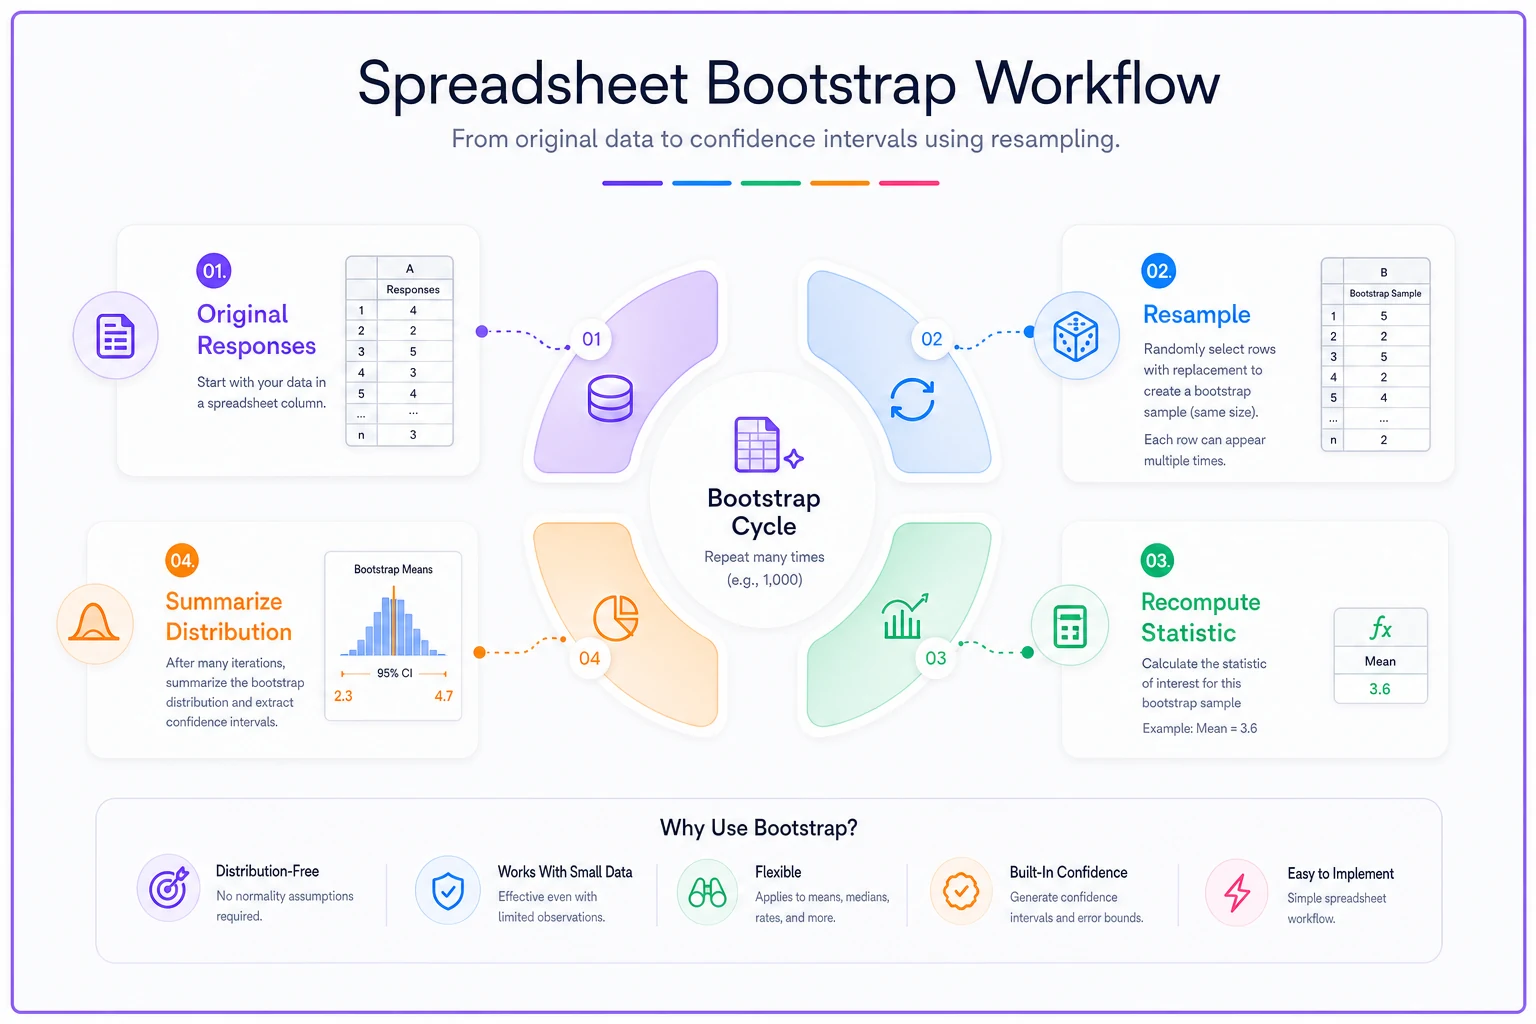
A simple visual of the resampling workflow helps communicate the process to non-statisticians in a review meeting.
200–500 resamples usually reveal whether the interval is wide enough to merit pausing action.
Do this once for a batch of shaky items and you'll stop arguing about individual numbers. The width of the interval settles most debates faster than the point estimate ever did.
Thresholds for delaying action
"Collect more data" is easy to say and rarely gets a number attached to it. Vague advice like that gets ignored because nobody knows when they're actually allowed to move. Some working thresholds that hold up in practice:
-
Under ~30 scored responses per item Treat all item statistics as directional only. No retirement, no rescoring based on numbers alone. Qualitative review only.
-
30–100 responses Statistics become usable for triage, not verdicts. Bootstrap anything you're about to act on. Difficulty is more trustworthy than discrimination here — proportions stabilize faster than correlations.
-
For distractor analysis specifically You need enough wrong answers, not just enough people. A rough floor is 8–10 responses per distractor before the pattern means anything. On an easy item where 90% got it right, you might have 500 test-takers and still can't analyze the distractors.
-
Negative discrimination This is the one exception where small N still warrants urgency — but only because it triggers a content check, not because the number itself is trustworthy. A negative point-biserial says "look at this item now," not "retire this item now."
The pattern behind all of these: proportions (difficulty) stabilize earlier than relationships (discrimination), and relationships stabilize earlier than sub-group breakdowns (distractors, DIF, fairness slices). Plan your patience accordingly.
When qualitative checks beat the math
At small N, a careful human read of an item is often more reliable than any statistic — and it doesn't need a sample size. This isn't a fallback. For tiny cohorts it's the primary tool.
-
Does the keyed answer actually match the content standard? A surprising share of "bad" items are just miskeyed.
-
Is there a defensible second-best answer? If two options are arguably correct, your discrimination will look terrible for a content reason, not a statistical one.
-
Does the stem give away or obscure the answer? Wording problems produce weird stats that no amount of data will fix.
-
Did anything change between administrations? New instructor, reordered curriculum, a leaked topic — context explains more small-N anomalies than the item itself.
-
Who's in this cohort? A pilot group of volunteers, or your strongest section, will distort everything. Small samples are rarely representative, and that's a validity issue, not a math issue.
This ties directly back to measurement fundamentals — at small N, validity and fairness reasoning carries the load that reliability statistics can't yet support.
A real scenario
A regional healthcare employer ran a new compliance certification for incoming nurses. First cohort: 44 candidates. The analyst pulled item stats and flagged six questions with discrimination under 0.15, plus one with a negative value. The instinct in the room was to rewrite all seven before the next cohort.
Instead they bootstrapped all seven. Five of the six "low discrimination" items came back with intervals so wide (roughly -0.05 to 0.30) that they couldn't be called bad — pure small-sample noise. The negative-discrimination item, when a subject expert read it, turned out to be miskeyed: the "correct" answer conflicted with updated protocol.
Outcome: they fixed the one genuinely broken item, left the other six alone, and tagged them to revisit after the next 40–50 candidates. When that data came in — bringing the total near 90 — four of the six settled into perfectly acceptable ranges. Rewriting them in round one would have burned a couple weeks of item-writing time and thrown away questions that were fine all along.
It came down to one habit: resample before you rewrite.
When this approach is a bad idea
Conservative triage is the right default at small N, but it has limits worth naming:
-
When there's a live fairness concern, waiting for more data isn't acceptable. If an item might disadvantage a group, you pull or review it now regardless of sample size — you don't let people keep taking a possibly-biased item while you collect responses.
-
High-stakes decisions on tiny cohorts shouldn't lean on item statistics at all. If a 30-person exam gates someone's certification or job, defensibility comes from content validity and process, not from p-values you can't trust.
-
When you'll never get more data. A one-time pilot that won't repeat can't wait for N to grow. Qualitative review is your only real tool in that case, and you should say so openly rather than dress up shaky numbers as evidence.
Conservative triage is the right default at small N, but it has limits worth naming:
Making patience operational
The reason small-N mistakes keep happening isn't that people don't understand sampling. It's that item reports don't show uncertainty. A dashboard prints "0.14" in a red cell and someone acts on it. Nobody sees that the honest version reads "0.14, but really anywhere from -0.05 to 0.35."
Assessment platforms that flag low-N items automatically — attaching a confidence interval or an "insufficient sample" tag instead of a bare number — quietly prevent most of these errors. If your item bank supports it, tag every item with its current response count and surface that next to the statistics. Even a simple "N=41 — interpret with caution" note next to each stat changes how people behave in the review meeting.
The tooling is secondary, though. The habit is what matters. Sort into act / watch / pause. Resample before you rewrite. Let a content expert override a shaky number, and let a shaky number defer to more data. Small samples aren't a reason to avoid item analysis — they're a reason to be honest about what the analysis can and can't tell you yet.
The tooling is secondary, though. The habit is what matters. Sort into act / watch / pause. Resample before you rewrite. Let a content expert override a shaky number, and let a shaky number defer to more data. Small samples aren't a reason to avoid item analysis — they're a reason to be honest about what the analysis can and can't tell you yet.
Ready to revolutionize your evaluation process?
Join over 2,000 organizations using Evaloly to optimize assessments, improve learner outcomes, and make data-driven decisions.