
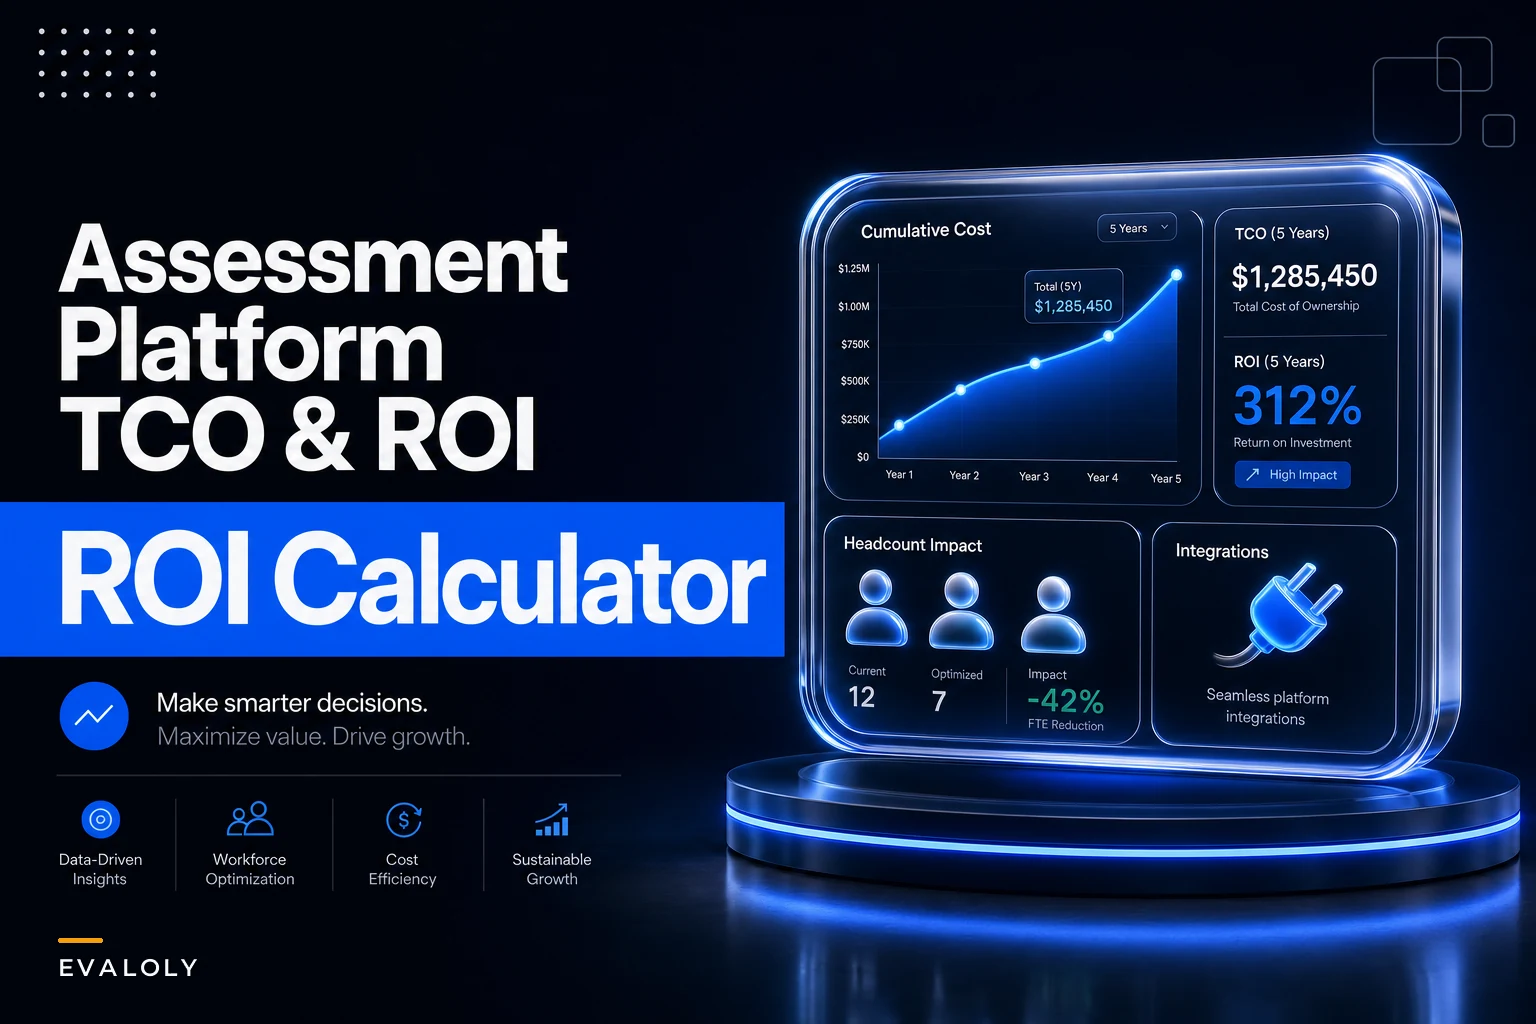

Most assessment platform cost estimates fall apart the moment someone in finance asks a follow-up question. You present a clean annual number, they ask "does that include the two FTEs maintaining the item bank?" and suddenly the whole thing wobbles. The license fee was never the problem — it's everything orbiting it that nobody bothered to model.
This piece is about building a TCO model specifically for assessment workflows. One that accounts for headcount, automation ROI, cloud and hosting, integration effort, and the sensitivity scenarios that make or break your break-even math. Not a generic SaaS TCO template with "assessment" copy-pasted over it. The cost structure of running exams, item banks, scoring pipelines, and proctoring is genuinely different, and modeling it like a CRM will get you burned.
Why assessment TCO breaks the standard SaaS cost model
A normal SaaS TCO is roughly: license + implementation + a fuzzy "admin time" line. Fine for a marketing tool. Useless for assessments, because the real cost drivers sit in places the standard finance template doesn't have rows for.
Three things make assessment platforms structurally different:
The labor is spiky and specialized. Item writing, psychometric review, forms assembly, and score appeals aren't steady-state admin. They surge around test windows and require people you can't easily backfill. A psychometrician's loaded cost is not the same line item as a help-desk rep's.
Volume costs are lumpy. Proctoring minutes, cloud compute for scoring large essay batches, and candidate seat licenses often scale in steps, not smoothly. You cross a threshold and the per-unit price resets.
Integration is recurring, not one-time. The LMS/HRIS connector you build isn't a capital expense you forget about. Every Workday update, every Canvas version bump, every SIS schema change costs maintenance hours. Teams model integration as a one-time install and then wonder why the real number is 2x.
If your model has a single "software cost" row and a single "staff time" row, it will underestimate by somewhere between 30% and 60%. That's the gap that gets a project approved and then quietly over budget by Q3.
The cost categories that actually belong in the model
Build your spreadsheet around these buckets, each with its own tab so you can trace every number back to an assumption.
Eliminate assessment bottlenecks.
Evaloly simplifies every step from test design to results analysis, making assessments faster and more reliable.
- Customizable test creation
- Automated grading and analytics
- Secure distribution and proctoring
No credit card required
| Cost category | What goes in it | How it scales | Commonly forgotten |
|---|---|---|---|
| Platform license | Per-seat or per-candidate fees, module add-ons | Steps by volume tier | Overage fees past contracted volume |
| Headcount (loaded) | Item writers, psychometricians, admins, QA | Surges around windows | Appeals/review labor, onboarding time |
| Automation / tooling | Automated scoring, forms assembly, routing | Mostly fixed, some usage | Human-in-the-loop review hours that don't disappear |
| Cloud / hosting | Compute for scoring batches, storage, proctoring minutes | Lumpy, threshold-based | Peak-window compute spikes |
| Integration | LMS/HRIS/SIS connectors, SSO | One-time build + recurring maintenance | Version-update maintenance, breakage |
| Compliance & security | Audit prep, accessibility remediation, data retention | Mostly fixed | Remediation when something fails an audit |
The non-obvious part: the categories people cut from the model first — appeals labor, integration maintenance, compliance remediation — are exactly the ones that behave unpredictably. Trimming the volatile line items and keeping the stable ones is backwards for risk modeling.
If you want to connect this to how a program decides which assessments even deserve this spend, the logic pairs well with a decision rubric for investment, sunset, and ROI across your portfolio. Running a full TCO on a test you should be sunsetting is just wasted precision.
Headcount: the line everyone gets wrong
The license fee shows up on an invoice. Headcount doesn't, which is why it's consistently underestimated.
A realistic loaded cost model for assessment staff needs three things most spreadsheets skip:
-
Loaded, not base, salary. Multiply base by roughly 1.25–1.4 for benefits, tools, and overhead. A $95k psychometrician costs you closer to $125k in reality.
-
Allocation percentage, not headcount. Nobody works 100% on one platform. Model the item-writing lead at 40%, the QA person at 25%, and so on. Summing fractional allocations gives you a far more honest number than counting bodies.
-
Surge labor as a separate line. Test windows create temporary spikes — contractor item writers, extra proctoring coordination, appeals reviewers. This often runs 15–30% on top of baseline during peak quarters.
A typical example: a mid-sized certification program estimated "two staff" at around $190k. When they modeled loaded cost, fractional allocation across five people, plus surge contractors during their two annual windows, the real number landed closer to $260k–$280k. Nothing was hidden — the simple model just didn't have rows for how the work actually happened.
That gap is the entire argument for automation ROI. You can't calculate what automation saves until you've honestly measured what the manual labor costs.
Automation ROI: model the hours that survive, not the hours you dream about
The most common automation ROI mistake is assuming automated scoring removes 100% of grading labor. It doesn't. Automated and AI-assisted scoring shifts labor from doing to reviewing and sampling — human-in-the-loop never hits zero, and modeling it at zero makes your ROI look fake to anyone who's actually run a scoring pipeline.
-
Baseline current labor hours per test cycle — writing, assembly, scoring, QA, appeals.
-
Post-automation the same categories with realistic reduction factors. Automated scoring might cut raw grading time by 60–70%, but you add back review-and-sample hours at maybe 15–20% of the original. Net reduction is more like 45–55%, not 70%.
-
ROI window savings per cycle × cycles per year, minus the automation tooling cost and the one-time workflow redesign effort.
A practical way to think about it: a mixed-format exam currently routes every response to a human grader. After introducing automated scoring with sampling, multiple-choice and short-answer items route straight through, constructed-response items get machine pre-scored and sampled at around 20% for human verification, and only flagged or low-confidence items go to full manual review. The labor doesn't vanish — it concentrates on the items where human judgment actually changes the outcome.
The piece most ROI decks miss: automation's real payoff on assessments is often variance reduction and turnaround speed, not just headcount savings. Faster score release and fewer manual errors have real value, but they don't show up if your model only counts salary dollars. Add a qualitative benefits row even if you can't fully monetize it — it defends the decision when the pure-dollar savings look thin in year one.
Cloud, hosting, and the peak-window trap
Cloud cost modeling for assessments fails when you use average load instead of peak load.
Assessment compute is bursty by nature. You might run near-idle for weeks, then slam the scoring pipeline with 8,000 constructed-response submissions in a 48-hour window. Model on monthly average and you'll badly undersize the budget. Proctoring minutes behave the same way — concentrated almost entirely inside test windows.
Build two numbers: steady-state monthly and peak-window monthly. Then weight by how many peak windows you run per year. A program with four testing windows has a very different cloud profile than one with continuous rolling assessment, even at the same annual candidate count.
The quiet cost here is storage retention. Assessment data carries long retention requirements for audit and appeals defensibility. You're not just storing this year's responses — you're carrying years of candidate data, item history, and score records. That storage line grows every year and almost nobody models the compounding.
Integration effort: the line item that keeps billing you
Teams model integration as "connect to Workday — $X, one-time." Then the connector breaks during a Workday update and the maintenance hours start.
Model integration in two parts:
-
Build the one-time effort to stand up each connector — LMS, HRIS/SIS, SSO. Estimate in engineering days and convert to cost.
-
Maintain recurring hours per connector per year. A reasonable starting assumption is 10–20% of the build effort annually, higher if the connected system updates aggressively.
Worth flagging: every additional integration doesn't just add its own maintenance — it adds surface area for breakage that interacts with everything else. Three deeply integrated systems create more fragile edge cases than the sum of three isolated ones. When you model a new connector, add a small integration-complexity premium rather than treating each as independent.
This is also where "cheaper" platforms sometimes lose. A platform with prebuilt, vendor-maintained connectors shifts maintenance cost off your team's ledger. One with DIY connectors looks cheaper on the license line and quietly more expensive on the headcount line. Your TCO model is the only place that tradeoff becomes visible.
Sensitivity scenarios: where the model earns its keep
A single-point TCO estimate is a guess with false confidence. The value is in the scenarios.
-
Volume +40% candidate count grows faster than expected. Watch how step-function license tiers and peak cloud costs jump — these often break first.
-
Automation underperforms your scoring automation delivers 40% labor reduction instead of 55%. How far does break-even slip?
-
Integration maintenance doubles a major HRIS version change hits. Does the whole business case still hold?
Run each and note which assumption your model is most sensitive to. For most assessment programs, it comes down to one of two things: labor allocation percentages or peak cloud and proctoring volume. Once you know your most sensitive variable, you know what to monitor most carefully after go-live — and what to negotiate hardest in the contract.
This sensitivity view also turns a cost model into an executive conversation. If you're presenting to leadership, the scenario columns map cleanly onto the kind of framing in an enterprise assessment scorecard built for executive decisions and budgets — executives don't want your point estimate, they want the range and what moves it.
Building the break-even calculator
The break-even calc answers one question: at what point does the automation and platform investment pay back against the status quo?
-
Status quo cost per period — current fully-loaded cost of running assessments manually.
-
New-model cost per period — platform + reduced labor + cloud + integration maintenance.
-
One-time costs — implementation, workflow redesign, data migration, initial integration build.
-
Cumulative difference — plot status-quo cumulative cost against new-model cumulative cost (including the upfront lump). The crossover is your break-even.
One thing people consistently miss: the new model usually costs more in the first period because of implementation and parallel-running — old and new systems running simultaneously during transition. Your line dips before it climbs. If your calculator shows instant savings from month one, you've probably zeroed out human-in-the-loop labor or skipped the parallel-run period, and finance will catch it.
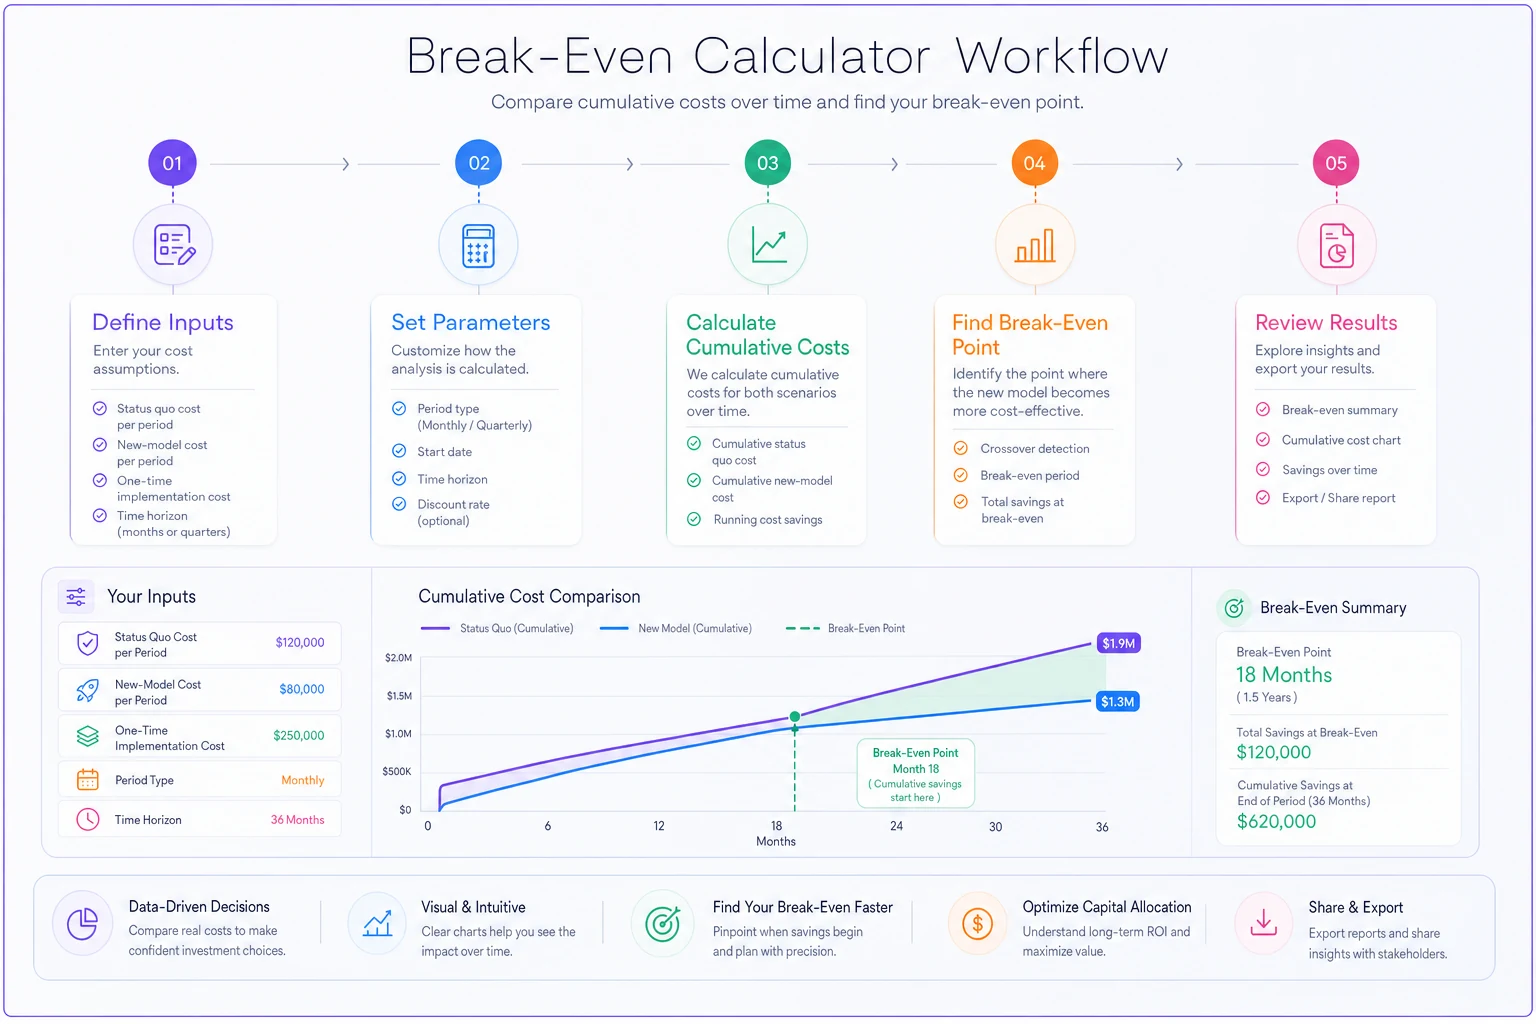
A defensible break-even for a mid-sized program with meaningful automation tends to land somewhere in the 14–22 month range once implementation is modeled honestly. If your model shows 6 months, re-check your assumptions.
A short real scenario
A regional professional-certification body ran two exam windows a year — roughly 6,000 candidates annually — scoring a mix of multiple-choice and constructed-response items mostly by hand.
Their original budget line was simple: platform license plus "the assessment team." About $150k for the platform, and they waved at staffing as a sunk cost already on the books.
When they rebuilt it as a proper TCO model, the picture shifted considerably. Loaded, fractional-allocation headcount came in near $270k, not the ~$190k they'd assumed. Peak-window cloud and proctoring added a lumpy line they'd never isolated. Integration maintenance on their SIS connector was eating roughly 60–80 engineering hours a year that nobody had attributed to assessments.
With automated scoring plus sampling layered in, their modeled net labor reduction was around 45–50% on scoring-related hours — not the 70% the vendor demo implied. Break-even landed near month 18 once implementation and a one-window parallel run were included. Not spectacular, but real — and it survived the finance review precisely because it wasn't spectacular. The committee approved it because the model already answered the follow-up questions before anyone asked them.
When this level of modeling makes sense — and when it doesn't
Do the full model when: you're running recurring high-stakes assessments, carrying dedicated assessment staff, integrating with HRIS/SIS/LMS, or asking for budget above a threshold where finance will push back. Anything with real headcount and real integration deserves this.
Skip the heavy version when: you're running occasional low-stakes quizzes with no dedicated staff, no integration, and off-the-shelf tooling. A six-tab sensitivity model for a program that costs $12k a year is just procrastination in spreadsheet form.
Who should be careful: teams commercializing assessments or selling certifications. Your TCO is also your cost-of-goods, and underestimating it quietly destroys margin. If that's your situation, the cost model needs to feed directly into pricing — the business model side of commercializing assessment and certification programs only works when the underlying TCO is honest.
A quick build checklist
Before you present the model, confirm it has:
-
- [ ] Separate tabs for each cost category, each traceable to an assumption
-
- [ ] Loaded salary (base × 1.25–1.4), not base, for all staff
-
- [ ] Fractional allocation percentages, not headcount
-
- [ ] A dedicated surge-labor line for test windows
-
- [ ] Human-in-the-loop review hours modeled (not zeroed out) post-automation
-
- [ ] Steady-state AND peak-window cloud/proctoring numbers
-
- [ ] Integration split into build + recurring maintenance
-
- [ ] Growing storage-retention line across years
-
- [ ] Three sensitivity columns (volume, automation underperformance, integration cost)
-
- [ ] A break-even calc that includes implementation and parallel-run costs
The items people skip on this list are almost always the ones that surface in the Q&A.
Final thought
The point of an assessment platform TCO model isn't to produce one impressive number. It's to produce a number that doesn't collapse under the second and third questions. Most models die at the follow-up — "what about the people?", "what happens at peak?", "does that include the integration we keep patching?" — because they were built to win approval, not to survive scrutiny.
Build it the other way around. Model the volatile line items first, the ones everyone trims. Keep human-in-the-loop labor honest. Separate steady-state from peak. Run the sensitivity scenarios before someone in the room runs them for you. A model that already answers the hard questions doesn't just get approved — it holds up eighteen months later when the actuals come in and you're still roughly where you said you'd be.
The point of an assessment platform TCO model isn't to produce one impressive number. It's to produce a number that doesn't collapse under the second and third questions. Most models die at the follow-up — "what about the people?", "what happens at peak?", "does that include the integration we keep patching?" — because they were built to win approval, not to survive scrutiny.
Build it the other way around. Model the volatile line items first, the ones everyone trims. Keep human-in-the-loop labor honest. Separate steady-state from peak. Run the sensitivity scenarios before someone in the room runs them for you. A model that already answers the hard questions doesn't just get approved — it holds up eighteen months later when the actuals come in and you're still roughly where you said you'd be.
Ready to revolutionize your evaluation process?
Join over 2,000 organizations using Evaloly to optimize assessments, improve learner outcomes, and make data-driven decisions.